Base Changes in Calving Traits
On August 12, 2025, calving traits calculated by CDCB for Holstein and Brown Swiss will undergo both a phenotypic and genetic base change.
Explanation of Changes
On August 12, 2025, calving traits calculated by CDCB for Holstein and Brown Swiss will undergo both a phenotypic and genetic base change. This comes after the routine five-year base change was delayed for the April 2025 evaluations following unanticipated results. Further investigation has validated the initial calculations.
In the calving ease and stillbirth evaluations a sire-maternal grandsire threshold model is used, where outputs are expressed in terms of probabilities or frequencies of difficult calvings (or stillbirth). In this model, the observed calving difficulty (or stillbirth) is understood as a combination of two factors: genetics (which we aim to improve through selection) and environment (management factors such as feeding and gestation practices). Environmental effects are incorporated into the final PTA because, for example, sires’ daughters calving in a “poor” environment will generally experience more difficult calvings, while daughters calving in a “good” environment will tend to have easier births.
In the Holstein breed, the average frequency of difficult calvings on first-parity cows from bulls born in 2020 (reported as Sire Calving Ease, SCE) is 1.36%, compared to 2.29% for bulls born in 2015. This is reflected as the phenotypic base for the trait. As this average approaches zero, PTA variability has decreased as a consequence. The low incidence of reported dystocic calvings naturally constrains PTAs since values below 0% are biologically impossible. Now is not the time to become lax in selection criteria for SCE, but producers should not be alarmed if minimal variability is seen across bulls in the population.
This difference in SCE is partly due to genetic progress and partly due to management improvements, such as better animal handling and increased use of sexed semen. The combined effect of the genetic and phenotypic base changes will result in a reduction in PTAs (indicating easier calvings) of approximately 0.8% in Holsteins. The opposite trend will be observed in Brown Swiss, where PTAs will reflect an increase in difficult calving of about 0.6%.
The calving traits differ from most other traits that CDCB evaluates because they are categorical and not continuous – a cow either experiences dystocia or not; there is nothing in between. To account for this, they are evaluated with sire/maternal grandsire (MGS) threshold models. The application of a breed-specific phenotypic base also makes these traits unique.
The Traits
Sire calving ease (SCE) = Predicts the tendency of service sires to produce offspring that are delivered easily, expressed as the percentage of births of calves coded “difficult” for first calf (primiparous) heifers compared to other A.I. bulls born in the reference year. Beginning in August 2025, this is set to 2020.
Daughter calving ease (DCE) = Predicts the tendency of the daughters of sires to have offspring that are delivered easily, expressed as the percentage of births of calves that are “difficult” in first calf (primiparous) heifers compared to other A.I. bulls born in the reference year. Beginning in August 2025, this is set to 2015.
Sire stillbirth (SSB) = Predicts the tendency of service sires to produce offspring that are stillborn (dead at birth or within 48 hours of birth), expressed as percent compared to other A.I. bulls born in the reference period. Beginning in August 2025, this is set to 2020.
Daughter stillbirth (DSB) = Predicts the tendency of the daughters of sires to have offspring that are stillborn (dead at birth or within 48 hours of birth), expressed as percent compared to other A.I. bulls born in the reference period. Beginning in August 2025, this is set to 2015.
Anticipated Impacts
Figure 1: All bulls average PTA (traditional) changes due to the combined effect of phenotypic and genetic base updates computed for calving ease and stillbirth.| Breed | Trait | Current Base (%) | New Base (%) | Average PTA Change | New Base Year |
|---|---|---|---|---|---|
| Holstein | SCE | 2.53 | 1.77 | -0.766 | 2020 |
| DCE | 3.10 | 2.59 | -0.51 | 2015 | |
| SSB | 6.48 | 4.29 | -2.19 | 2020 | |
| DSB | 7.09 | 6.13 | -0.96 | 2015 | |
| Brown Swiss | SCE | 2.27 | 2.85 | +0.58 | 2020 |
| DCE | 3.01 | 3.46 | +0.45 | 2015 |
| Breed | Trait | Current Base (%) | New Base (%) | Average PTA Change | New Base Year |
|---|---|---|---|---|---|
| Holstein | SCE | 2.08 | 1.44 | -0.64 | 2020 |
| DCE | 2.16 | 1.78 | -0.38 | 2015 | |
| SSB | 5.8 | 3.8 | -2.00 | 2020 | |
| DSB | 4.88 | 4.17 | -0.71 | 2015 | |
| Brown Swiss | SCE | 2.43 | 3.05 | +0.62 | 2020 |
| DCE | 2.93 | 3.37 | +0.32 | 2015 |
The Data That Supports Calving Traits
Calving traits are calculated using producer-recorded data stored in farm software, processed at a Dairy Records Processing Center, and shared with the National Cooperator Database. Traits that accurately reflect realities on farms are directly tied to consistent data recording across maternity teams on individual farms and recording on farms across the county. As a refresher, here is how the five-point calving ease scale is defined.
Calving Ease: Scale of 1 to 5 as reported by producers
1 = Quick, easy birth with no assistance
2 = Over two hours in labor, but no assistance
3 = Minimum assistance, but no calving difficulty
4 = Used obstetrical chains
5 = Extremely difficult birth that required a mechanical puller
For genetic evaluations, calving ease scores of 4 and 5 are combined as the measure of dystocia. It should be noted that herds only reporting calving ease scores of 1 are excluded from genetic evaluations. The consistent, across-time reporting of only one category is a sign of poor data quality in most cases.
Stillbirth PTAs rely on a scale of 1 to 3 that is applied to event categories. For genetic evaluations, scores of 2 and 3 are combined to account for categorically stillborn calves.
1 = Live calf
2 = Calf born dead
3 = Calf born alive, but died within 48 hours
Additional Insight:
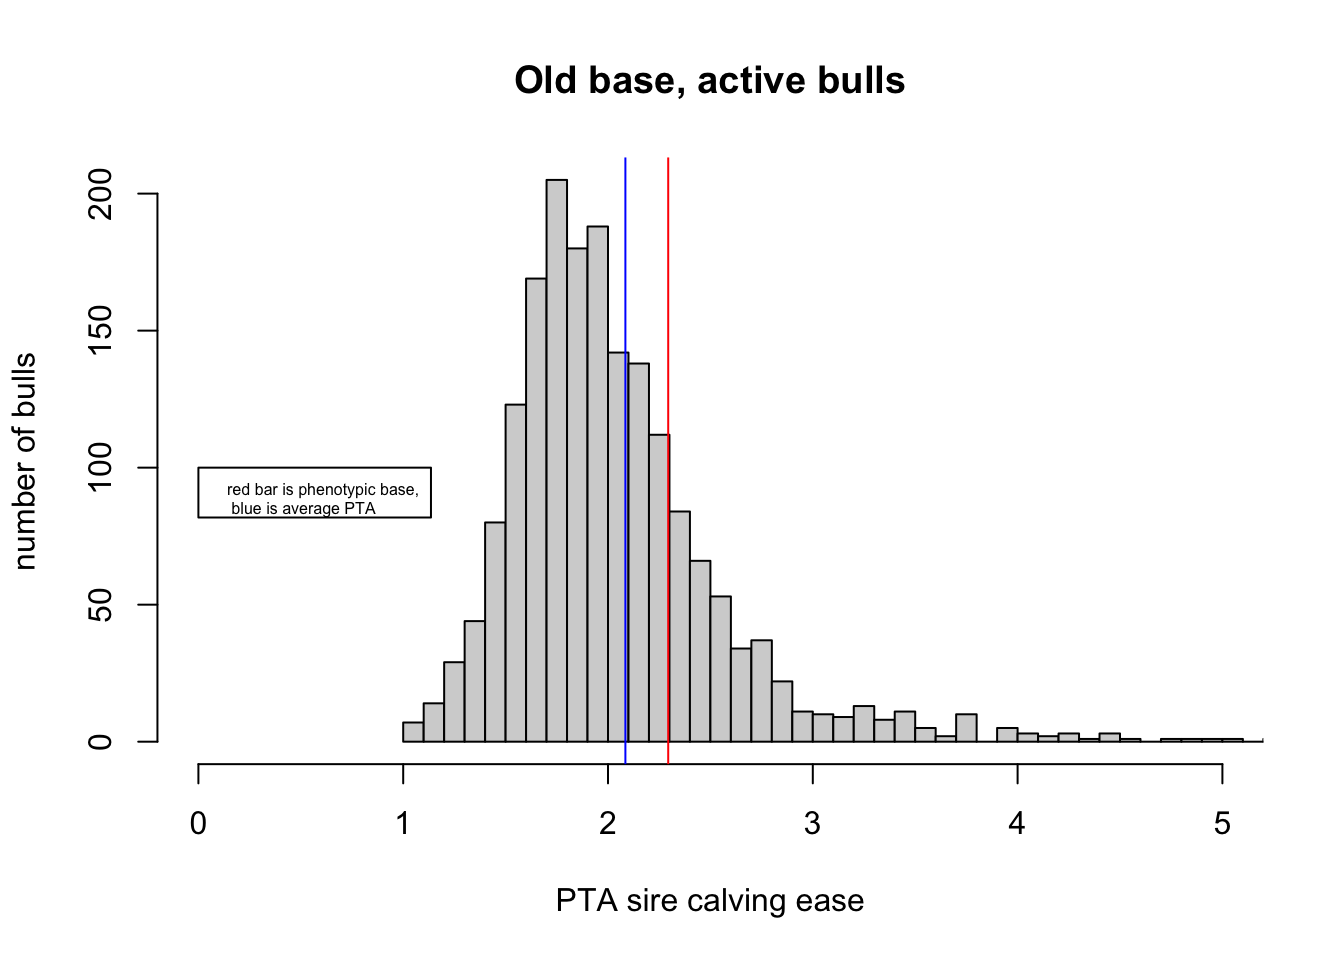
How current Holstein bulls’ PTAs for SCE compare using the 2015 (old) and 2020 (new) base years
The histogram below on the left shows the distribution of Holstein bulls’ PTAs for SCE, expressed on the 2015 genetic and phenotypic basis, for “current” bulls. Here, “current” bulls consist of both Active A.I. (A) and Genomically Tested (G) bulls.
In the plot, the red line represents the 2015 phenotypic base, while the blue line marks the mean PTA of the current bulls. Visually, about 70% of the current Holstein bulls fall to the left of the red bar, indicating that most bulls today are slightly better (i.e., easier calving) than the bulls whose calves contributed to establishing the 2015 phenotypic base. This is expected, as today’s bulls are younger and have benefited from the ongoing genetic improvement for SCE.
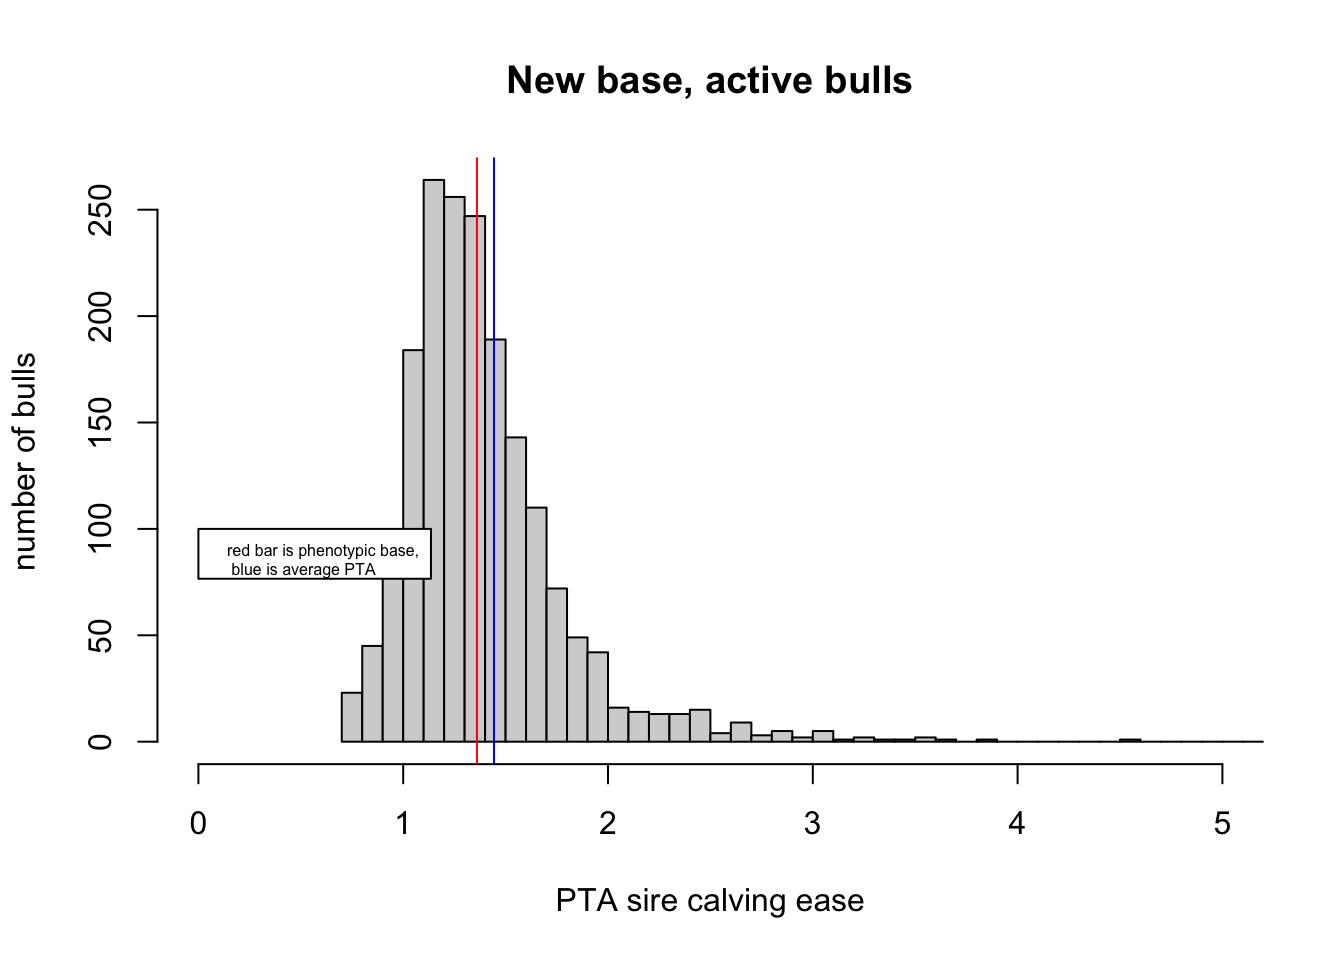
The histogram below on the right shows the same bulls’ distribution and average SCE PTA expressed on the 2020 genetic and phenotypic base year. In this case, the red line represents the 2020 phenotypic base. The average PTA of the active bulls (blue line) falls almost exactly on the red one. This outcome is expected by definition: the phenotypic base for SCE reflects the average calving difficulty of calves born from contemporary bulls. As a result, 48% of the current bulls have a PTA for SCE lower than the phenotypic base.
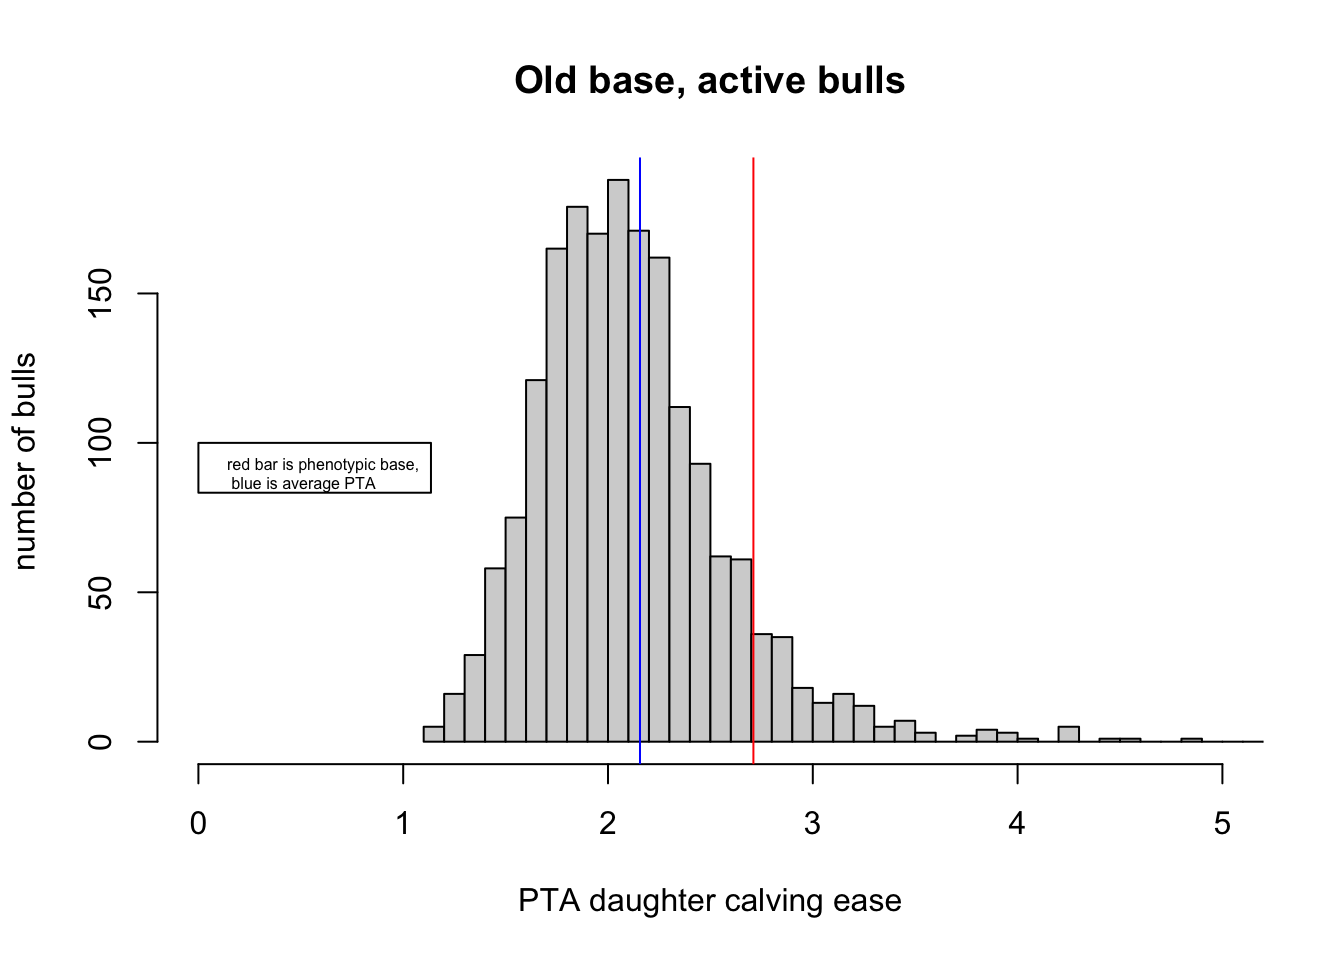
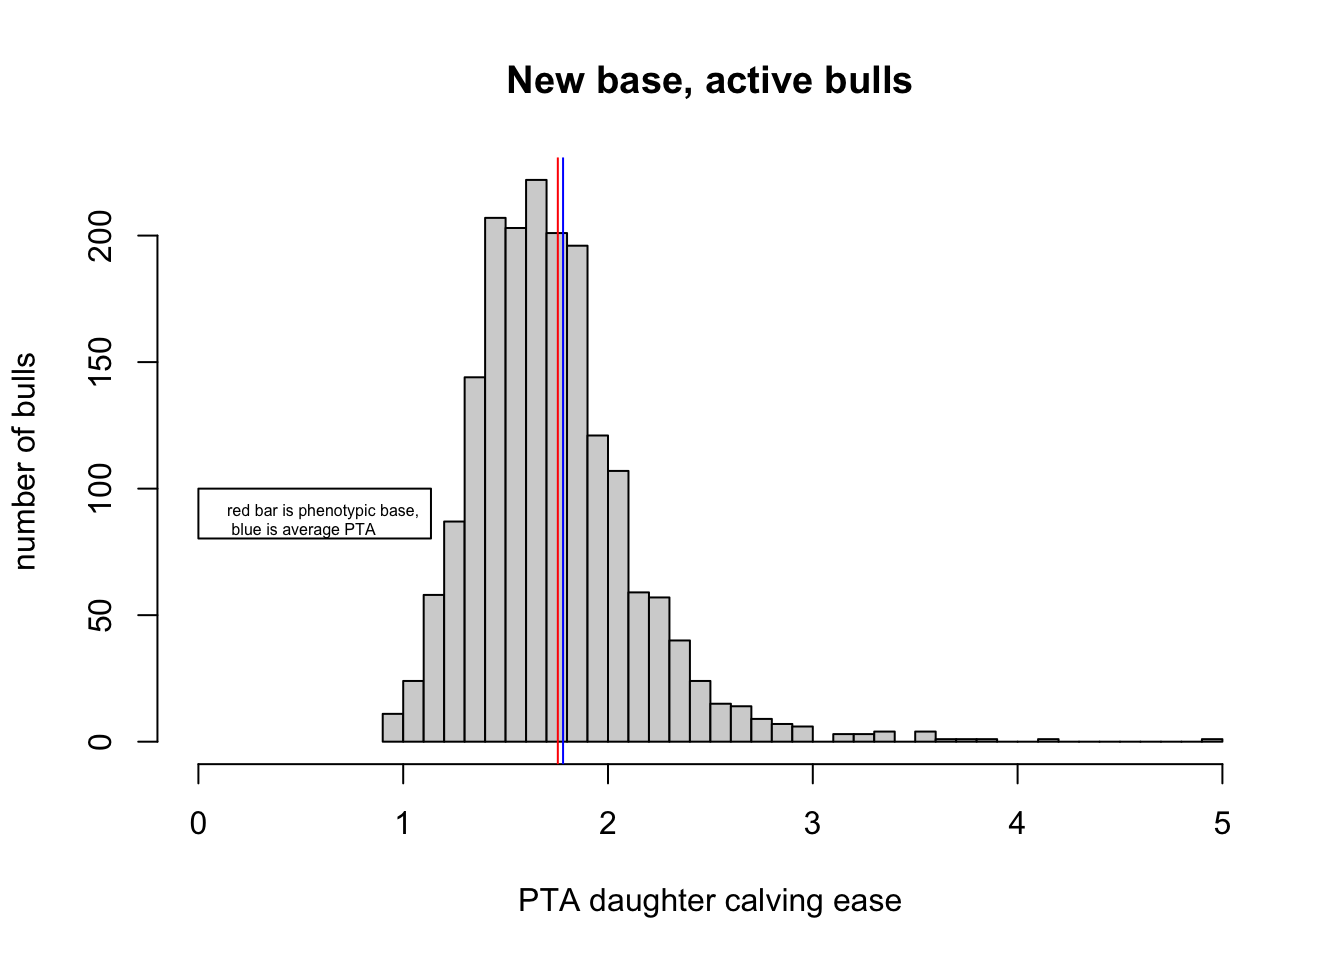
Daughter Calving Ease
We observe similar patterns in the change of base for the Daughter Calving Ease (DCE) trait, comparing the old base — defined as the dystocia frequency of calves with Holstein maternal grandsires born in 2010 — with the new base from calves with maternal grandsires born in 2015.
The same trend appears: active bulls’ PTAs are centered around the phenotypic base (with 53% falling below the red line), while most historical bulls have higher dystocia rates (only 11% are below the phenotypic base), reflecting the impact of genetic progress.